Monitoring
Tools
We currently have the following monitoring tools:
- grafana: running locally to view logs and metrics
- loki: running in the cloud as a grafana data source to view logs.
- prometheus: running in the cloud as a grafana data source to capture metrics
- hubble: running hubble-ui in the cloud to view network traffic
- hubble-cli: running locally to query hubble
- tetragon: running in the cloud to watch the processes of the Jupyter notebook pods, whose events are shipped to loki
To set up monitoring tools, we assume AWS full stack has been deployed. See stacks for details on deployment of the full stack.
Set up kube port-forwarding
Set up cloud port-forward for the tools you want to access:
# loki
kubectl port-forward svc/loki 3100:3100
# prometheus
kubectl port-forward svc/kube-prometheus-stack-prometheus 9090:9090
# hubble-ui
kubectl port-forward svc/hubble-ui -n kube-system 12000:80
# hubble-cli
kubectl port-forward svc/hubble-relay -n kube-system 4245:80
Grafana
Run grafana via docker:
docker run -d --name grafana -p 3000:3000 grafana/grafana
Open the Grafana UI at http://localhost:3000 and login with credentials admin/admin.
Save local Grafana config
You can run your dockerized Grafana persisting the config each time with:
docker run -d --rm --name grafana -p 3000:3000 -v $LOCAL_GRAFANA_CONFIG_DIR:/var/lib/grafana grafana/grafana
You’ll need to add --network=host on Linux or you won’t be able to talk to any of the forwarded ports.
To save all the metadata files the first time:
docker cp YOUR_CONTAINER_ID:/var/lib/grafana $LOCAL_GRAFANA_CONFIG_DIR
Note you may need to execute sudo chown -R 472:472 $LOCAL_GRAFANA_CONFIG_DIR to give Grafana permissions. User/group 472 is the Grafana user.
Loki
In Grafana UI, add a Loki Data Source pointing to http://localhost:3100.
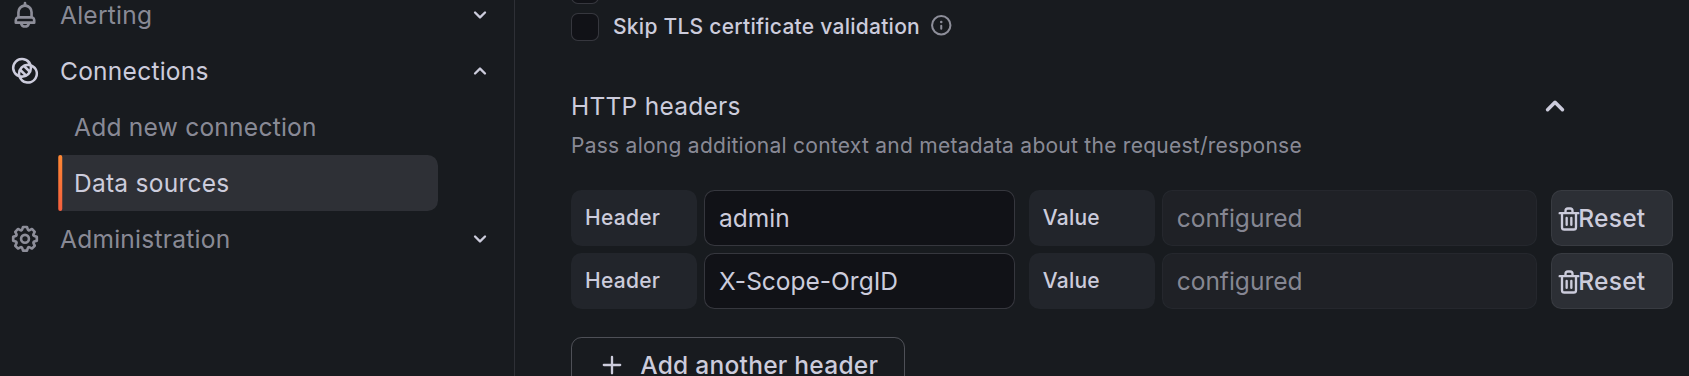
NOTE: In the HTTP headers section, a single entry needs to added with:
Headername:X-Scope-OrgID- The cluster name value (
CLUSTER_NAMEfrom configuration).
NOTE: On macos, use http://host.docker.internal:3100 in place of http://localhost:3100, if getting connection refused when adding the data source.
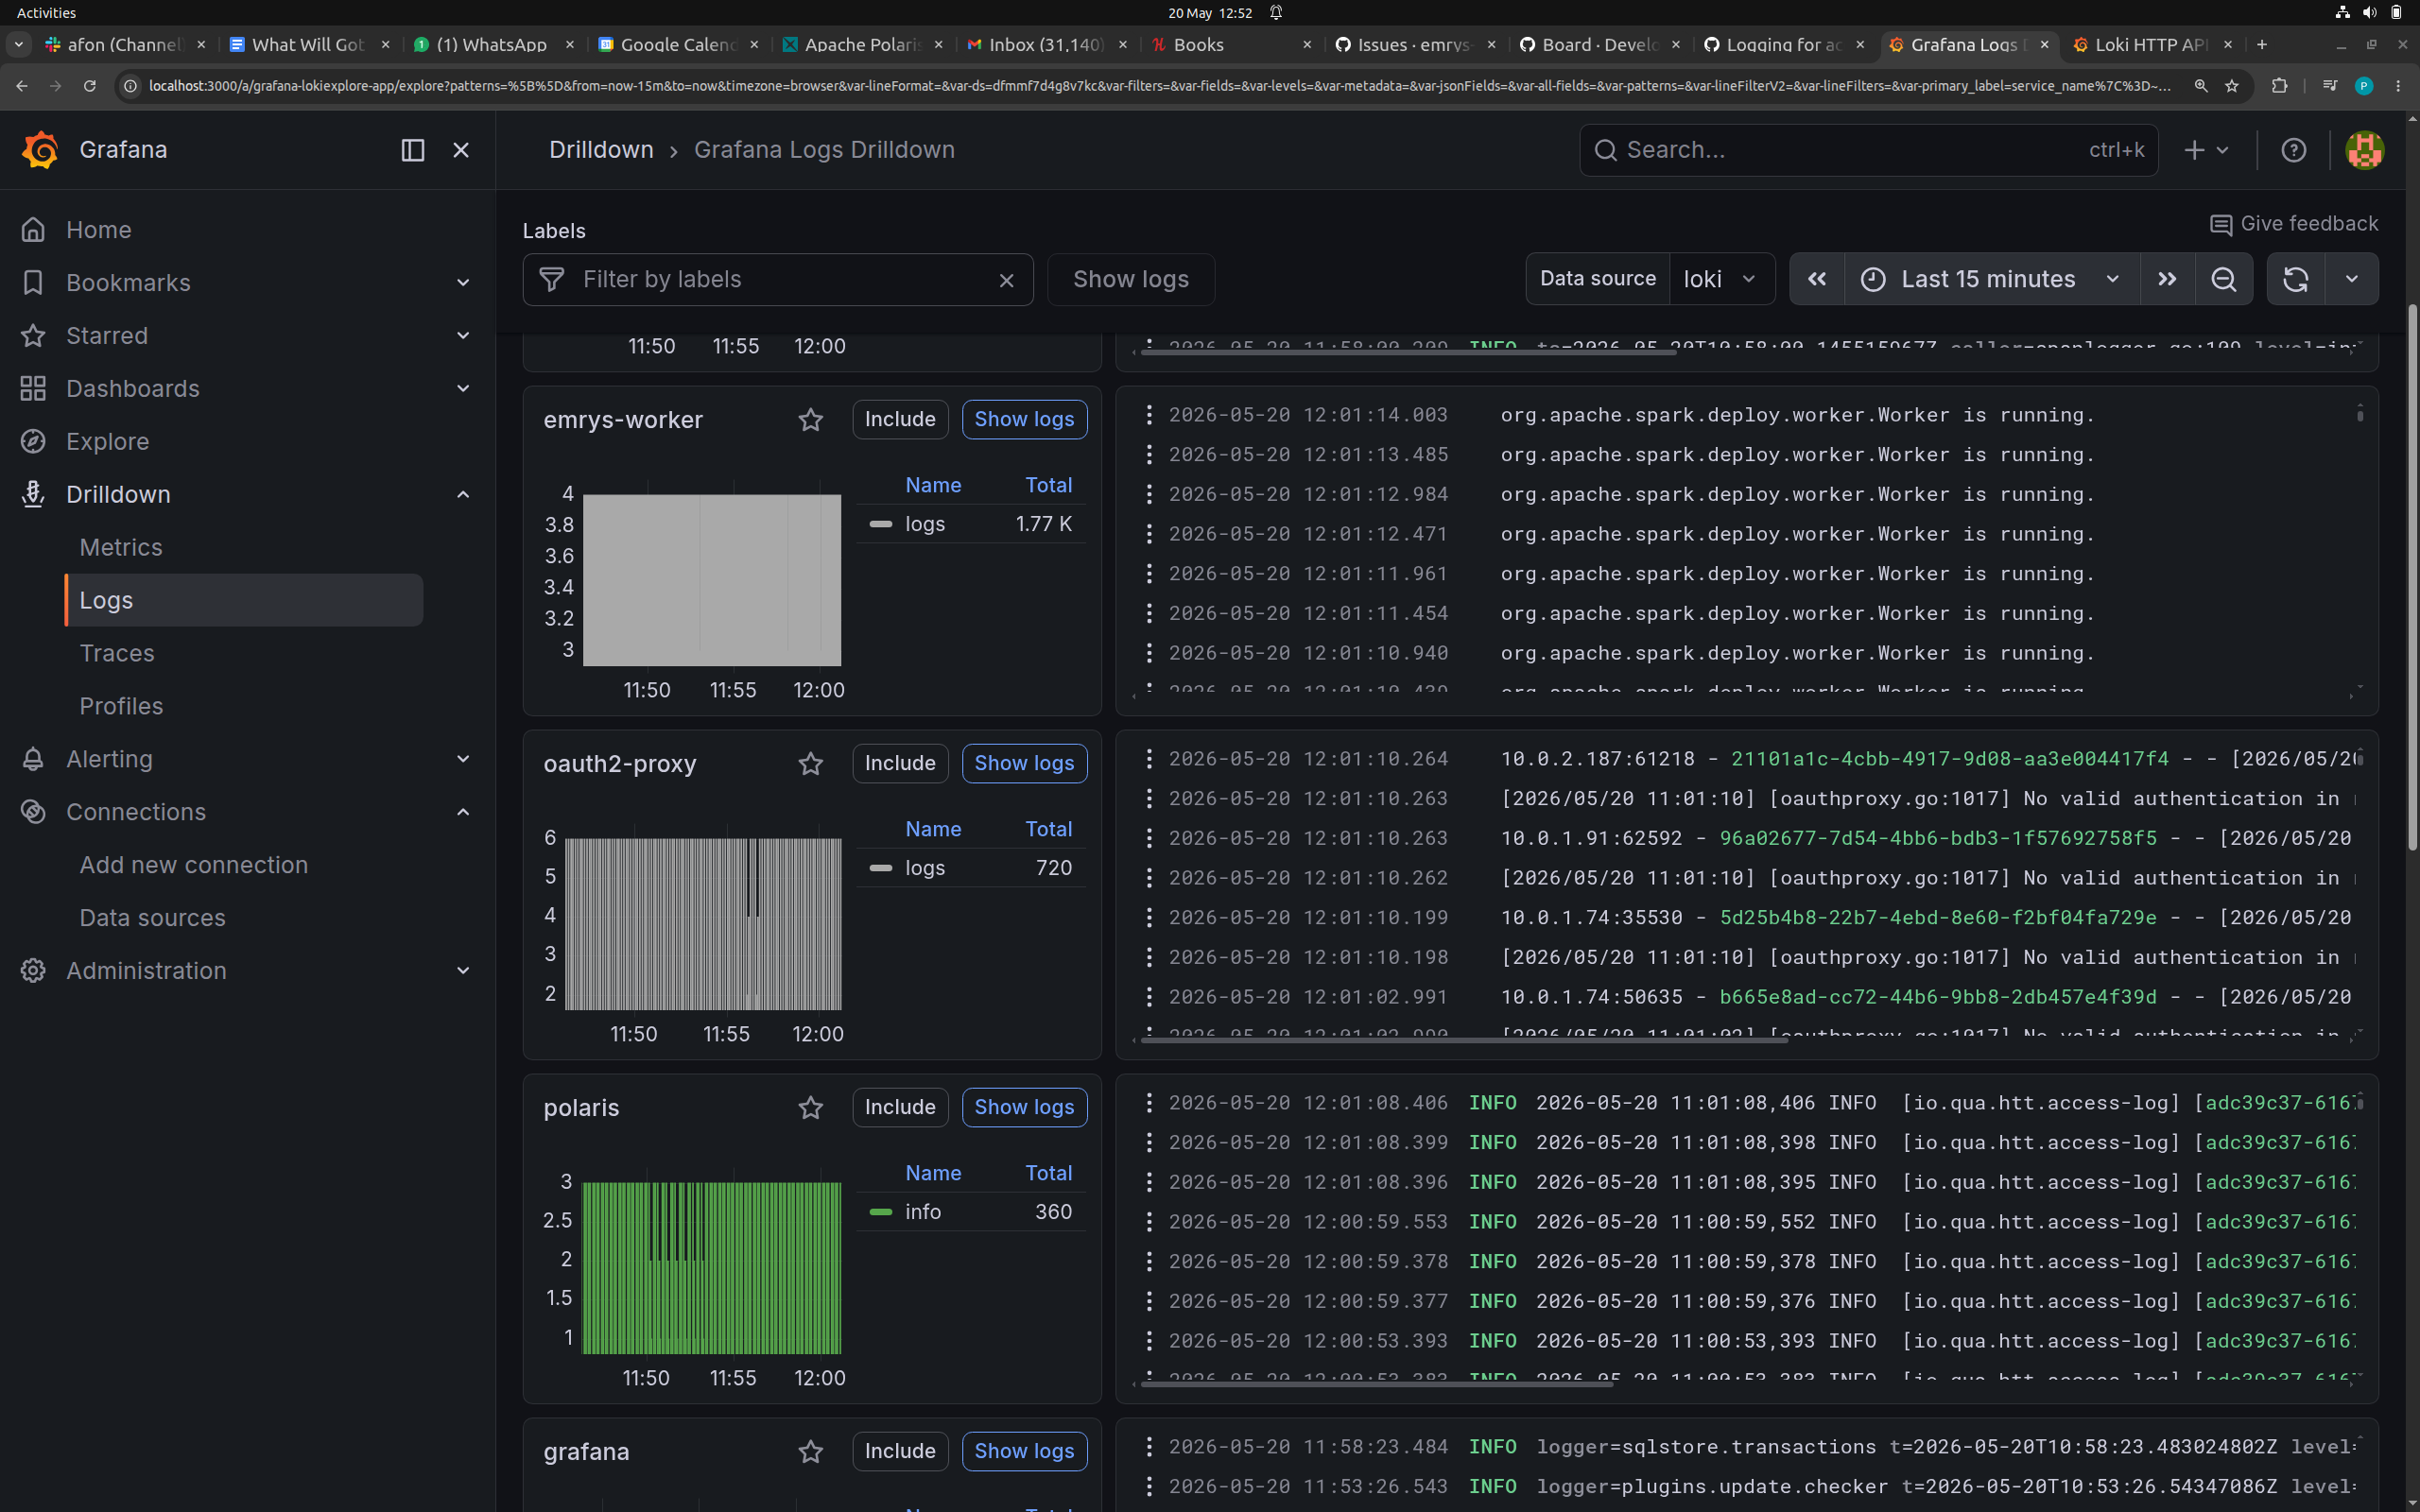
Once the data source is configured, logs will be available in the Grafana GUI (Drilldown -> Logs). You may need to refresh your browser.
Loki persists its logs to the bucket defined by AWS_S3_BUCKET_NAME in the configuration. Loki logs are stored in the cloud, eg
aws s3 ls s3://emrys-afon-bucket/spark-cluster
Tetragon
The Tetragon component of the full stacks runs Tetragon on every node, watching the notebook pods that JupyterHub spawns (those labelled afon-role=jupyter-singleuser): every process they exec, and its exit, with the pod, container, image, binary and arguments. Only the events of those pods are exported, as JSON lines printed by the export-stdout container of the tetragon pods, which Promtail ships to Loki with the logs of the other pods.
In Grafana, the events are queried with, eg
{app="tetragon", container="export-stdout"} | json | process_exec_process_pod_name=~"jupyter-.*"
and the processes a notebook runs listed with
{app="tetragon", container="export-stdout"} | json | line_format " "
Locally, with the tetra CLI, the events of a node are followed with:
kubectl exec -ti -n default ds/tetragon -c tetragon -- tetra getevents -o compact --pods jupyter-
Prometheus
In Grafana UI, add a Prometheus Data Source pointing to http://localhost:9090. One should see nearly 2000 metrics.
NOTE: On macos, use http://host.docker.internal:9090 in place of http://localhost:9090, if getting connection refused when adding the data source (see https://github.com/grafana/grafana/issues/46434).
Hubble
Hubble UI
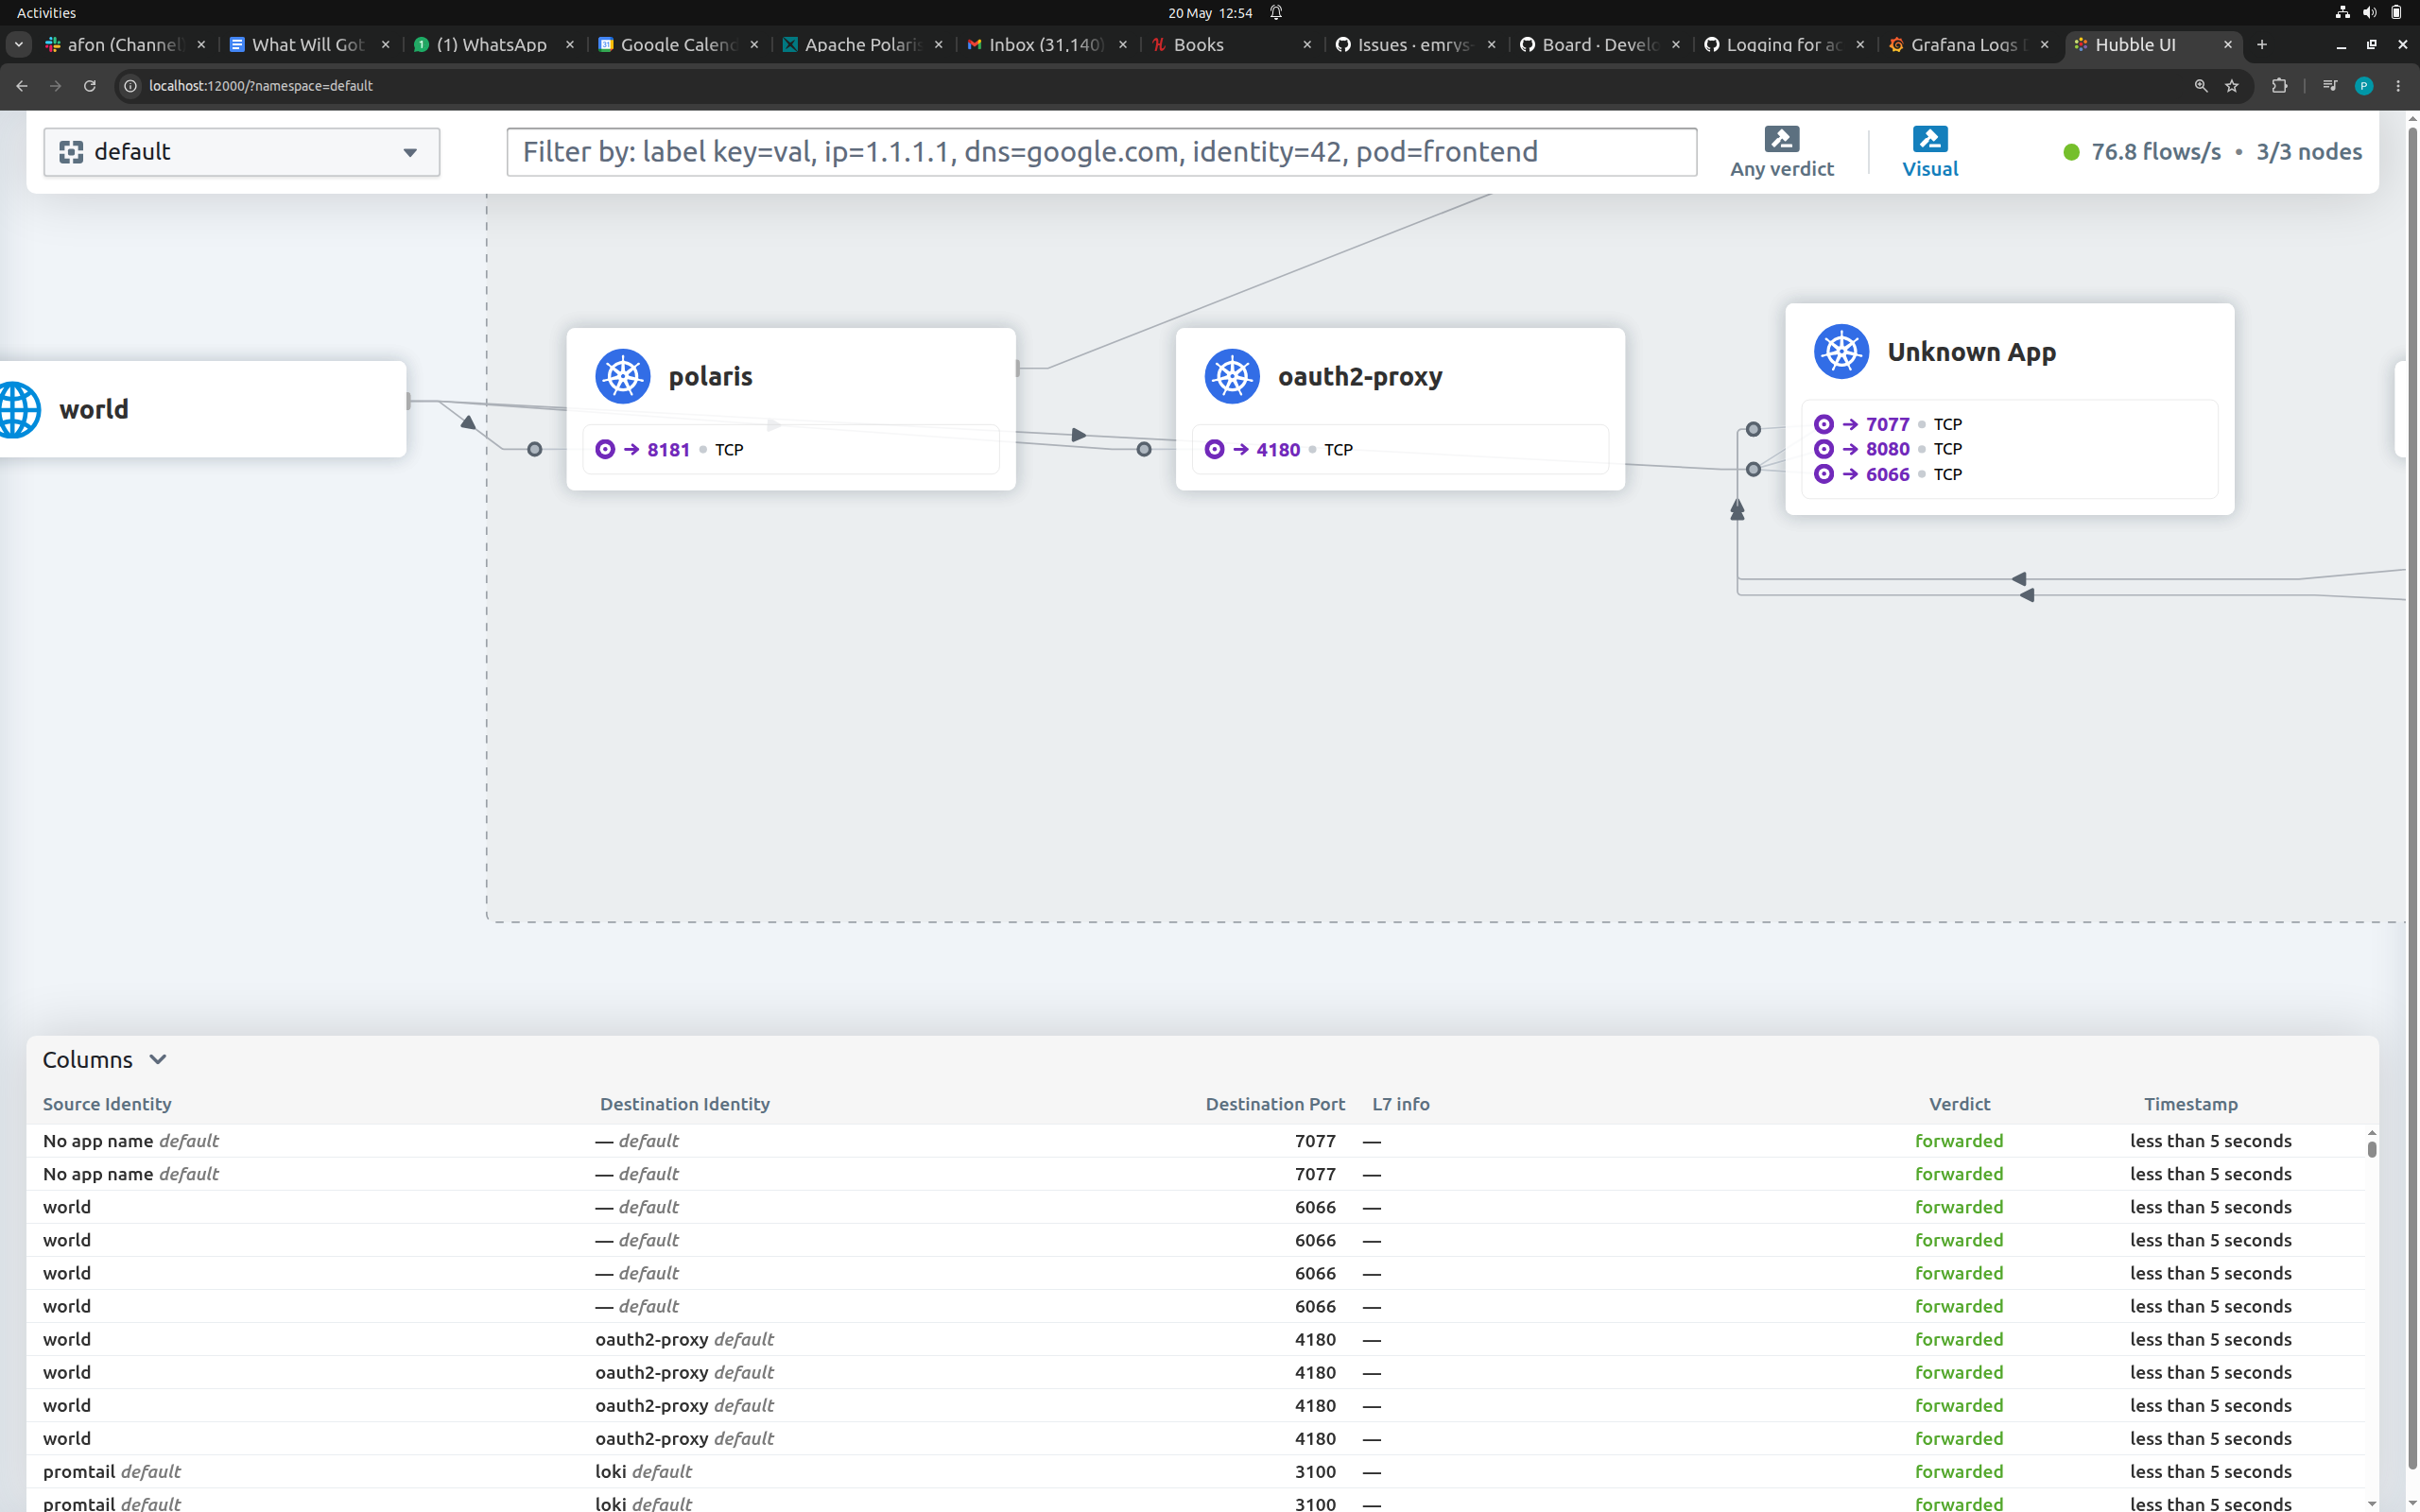
Once the hubble-ui kube tunnel is setup, the Hubble UI is available at http://localhost:12000 One should see the network flows between pods.
Hubble CLI
Install the Hubble CLI client:
- linux: Hubble CLI
- macos: brew install hubble
Once the hubble-relay kube port-forward is set up the hubble CLI is avalaible by running:
hubble observe
This will print out something akin to netstat in Linux:
$ hubble observe
Jun  1 09:05:34.677: 10.0.1.196:40327 (host) -> 18.169.47.27:443 (world) to-network FORWARDED (TCP Flags: ACK, PSH)
Jun  1 09:05:35.097: 10.0.1.196:46270 (host) -> 18.169.47.27:443 (world) to-network FORWARDED (TCP Flags: ACK)
Jun  1 09:05:36.323: 10.0.2.139 (remote-node) -> 10.0.1.24 (health) to-endpoint FORWARDED (ICMPv4 EchoRequest)
Jun  1 09:05:36.323: 10.0.2.139 (remote-node) <- 10.0.1.24 (health) to-network FORWARDED (ICMPv4 EchoReply)
Jun  1 09:05:36.323: 10.0.2.139:55266 (remote-node) -> 10.0.1.24:4240 (health) to-endpoint FORWARDED (TCP Flags: ACK, PSH)
Jun  1 09:05:36.324: 10.0.2.139:55266 (remote-node) <- 10.0.1.24:4240 (health) to-network FORWARDED (TCP Flags: ACK, PSH)
...
Blob storage size
- AWS
aws s3 ls s3://emrys-afon-bucket/acceptancetests/ --recursive --summarize | grep "Total Size - Azure
az storage blob list --account-name afonstorageaccount --container-name afonstorage --prefix acceptancetests/ --query "[].properties.contentLength" --output tsv | awk '{sum+=$1} END {printf "%.2f kb\n", sum/1024}' - GCP
gcloud storage du -s gs://emrys_afon_core/acceptancetests/**